In this tutorial, we’ll show you how to allow your users to create Visualizer charts on the frontend of your WordPress site. For this we are going to use the Visualizer plugin and the WP Frontend Admin plugin.
Once you finish, your frontend charts page will look like this:
Visualizer allows you to create all kinds of tables, charts, and graphs on your website to present the information in a really useful and beautiful way. This is extremely useful if, for example, you want to build a website to constantly publish research results. Whatever the case, it will be a great companion when it comes to creating tabs and graphs. You can download it here. This plugin has a free and a paid version, but in this tutorial we’ll use the free version.
WP Frontend Admin is the best tool to create hundreds of frontend pages with just a few clicks. You can create entire frontend dashboards and integrate them to WordPress Multisite and WP Ultimo. This is really useful if you want to create web apps using WordPress plugins behind the scenes. You can earn a lot of money with no programming knowledge.
You can try the premium plugin on your website for free for 7 days.
After installing the WP Frontend Admin plugin, you need to follow these simple steps to allow your users to create charts, tables and graphs on the frontend.
1- View the Visualizer Library on the frontend
The first thing we’ll do is open the Visualizer Library. Go to Visualizer > Chart Library.
After that, click View on the frontend to display this admin content on the frontend. As you see, it’s really simple because you don’t have to program the frontend admin pages from scratch.

2- Select the frontend page’s basic information on the frontend
After you click View on the frontend, the plugin will display the admin content on the frontend of your WordPress site.
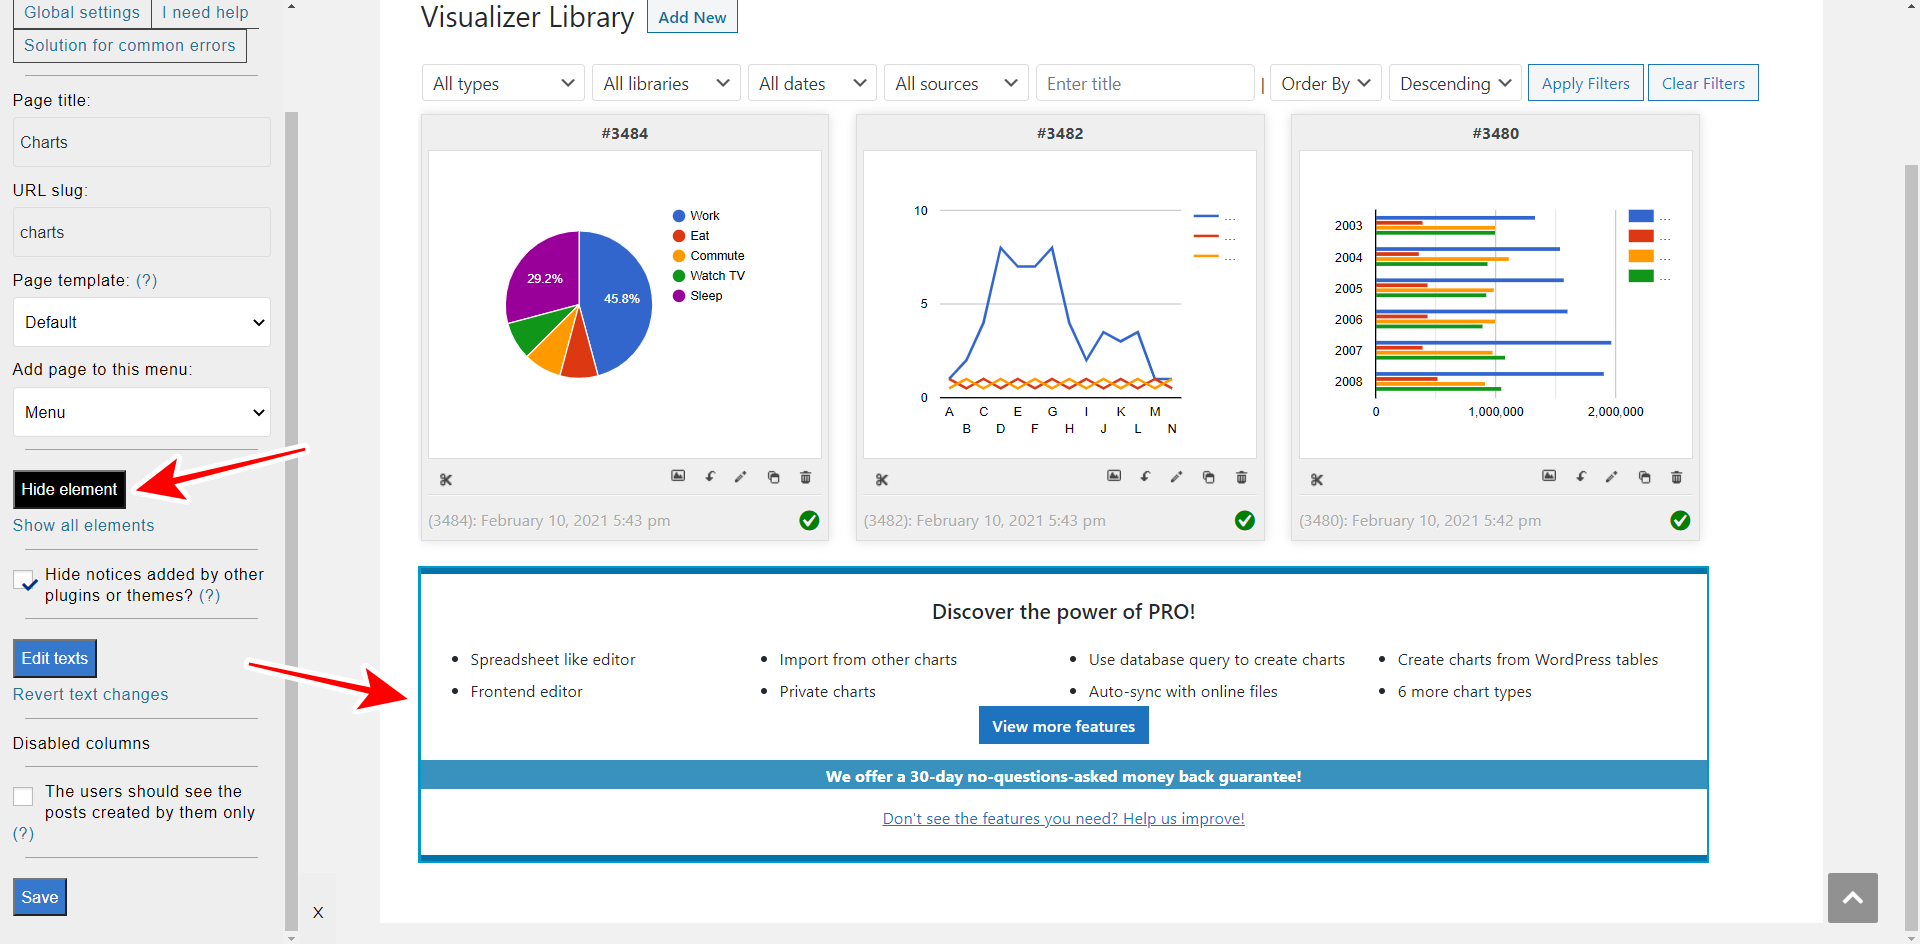
WP Frontend Admin allows you to edit your frontend pages using the Quick Settings panel on the left side of the screen. You can start by selecting the page’s basic information using the following fields:
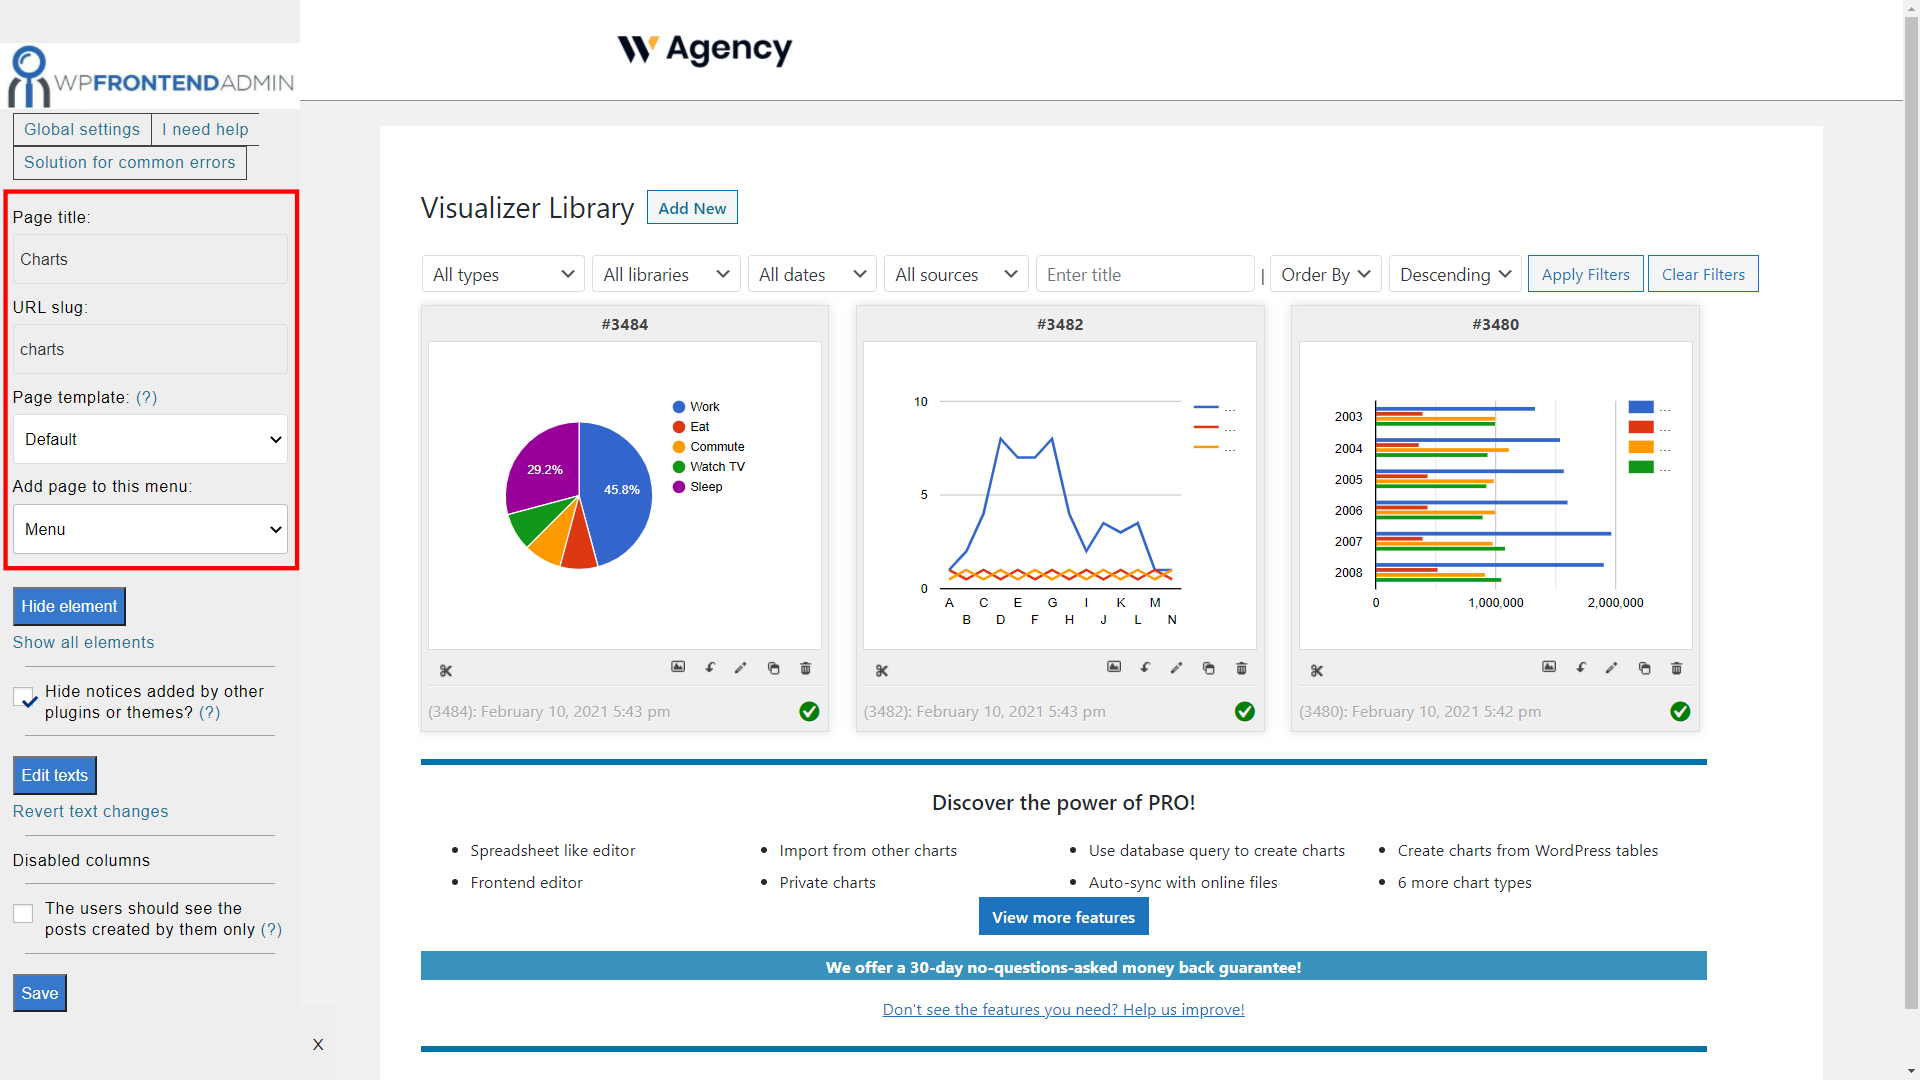
- Page title: Enter the page title here; in this case, we’ll call it “Charts”.
- URL slug: Enter the URL slug here using keywords only.
- Page template: Select the page template that best fits your needs for this page. We’ll select the Default template to use our theme’s template. We have prepared beautiful templates for your frontend pages and dashboards. You can preview and download them here.
- Add page to this menu: Select the menu where you want to display the Visualizer Library. This is really useful if you’re creating a frontend dashboard because you can integrate all the dashboard pages to this menu.
3- Hide any unnecessary elements from the page
WP Frontend Admin allows you to hide any unnecessary elements from your frontend pages to simplify them and make them look cleaner and more elegant. Since we’re using the free version of the Visualizer plugin, we can hide any references to pro upgrades. But you can also hide any other element if you want.
- Click Hide element.
- Click the element you want to hide.
You can repeat this two-step process with as many elements as you want to hide from the Visualizer frontend library.
4- Complete your Visualizer frontend library configuration
Now that you have hidden any unnecessary elements, you can finish the configuration with some optional features:
- You can toggle the Hide notices added by other plugins or themes checkbox to prevent users from viewing any notices that have nothing to do with them. Also, it’s useful if you’re creating a platform for a client who doesn’t need to view any notices.
- You can toggle the The users should see the posts created by them only checkbox. With this checkbox enabled, users will see their own charts, tables or graphs only.
- Finally, you can click Save to apply the changes and publish the page.

Once the page is published, your users will be able to log in and create Visualizer charts on the frontend. Here’s a gif of how the Visualizer library and create chart form will look on the frontend.
As you see, it’s really simple to allow your users to create Visualizer charts and use the library on the frontend. You don’t need to program anything, just click on one button and configure some fields to create a cool and useful frontend page.
You can try the premium plugin on your website for free for 7 days.
IMPORTANT QUESTIONS
1- Is WP Frontend Admin for the Visualizer plugin only?
No. You can display any admin page on the frontend, and it works with all WordPress plugins.
2- Is the plugin compatible with page builders?
Yes. You can use it with other page builders such as Elementor, Visual Composer, Gutenberg, Divi, Beaver Builder, WP Page Builder, Page Builder by SiteOrigin, Oxygen, Live Composer, Brizy, and many others. In that case, you need to use this shortcode in a page’s content to display wp-admin content on the frontend:
[vg_display_admin_page page_url="wp-admin URL"]
Just make sure you replace the wp-admin URL text with the URL of the admin content you want to display on the forntend.
3- Which users will be able to view the Visualizer charts on the frontend?
You can see which user roles can view the Visualizer library on the frontend by clicking Solution to common errors on the Quick Settings panel. This is the list of user roles that can see the Visualizer library on the frontend:
- administrator
- editor
- author
- contributor
- shop_manager
- lp_teacher
- tutor_instructor
- wpas_manager
- wpas_agent
You can, however, follow this tutorial to give the necessary capability (edit_posts) to any other user role.
4- Can I integrate this with WordPress Multisite?
Yes. You can integrate WP Frontend Admin with WordPress Multisite to create multisite platforms for frontend chart creation.
You can try the premium plugin on your website for free for 7 days.